
AI For Trading:Portfolio Risk and Return (42)
Portfolio Variance
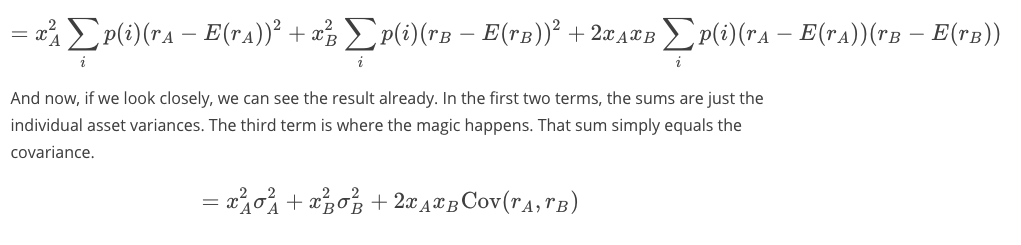
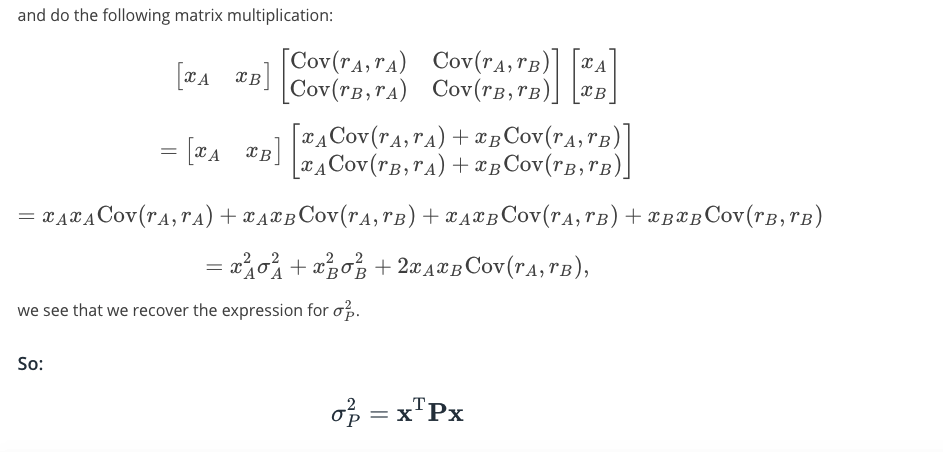
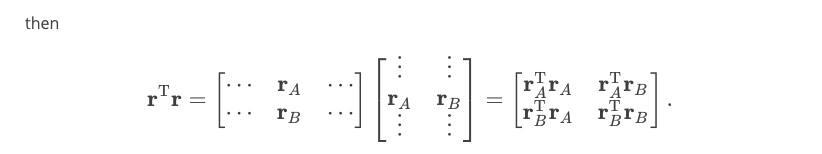
Derivation of Portfolio Variance
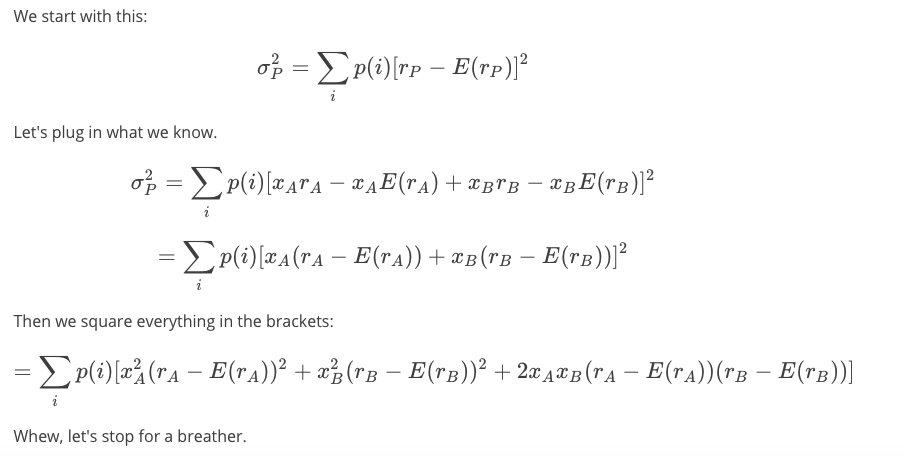
Mmmmk. So now, we do the same thing we did in the derivation of the portfolio mean. Instead of putting everything into one big sum, we break the big sum up into sub-sums, and pull out the weights, which aren't indexed by i.
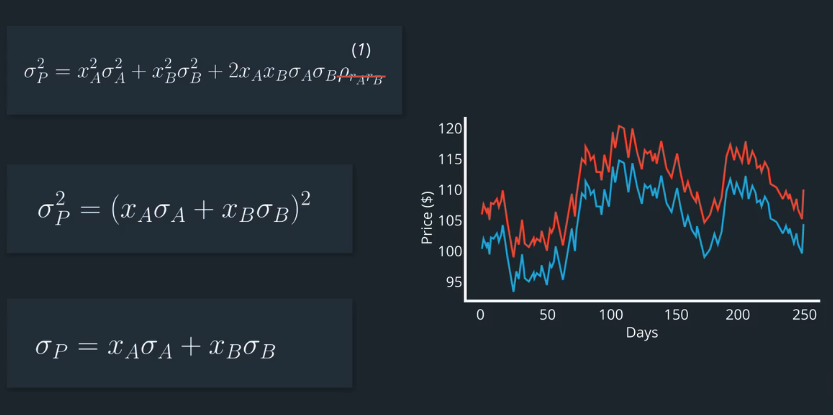
Reducing Risk
Reducing Risk with Imperfectly Correlated Stocks(通过不完全相关的股票降低风险)
We just noted that when the correlation is less than one (ρ\<1) , the portfolio standard deviation is less than the weighted average of the individual standard deviations:
我们刚才注意到当相关性小于1(ρ\<1)时,投资组合标准差小于各个标准差的加权平均值:

Let’s walk through this together to see how this helps us as investors.
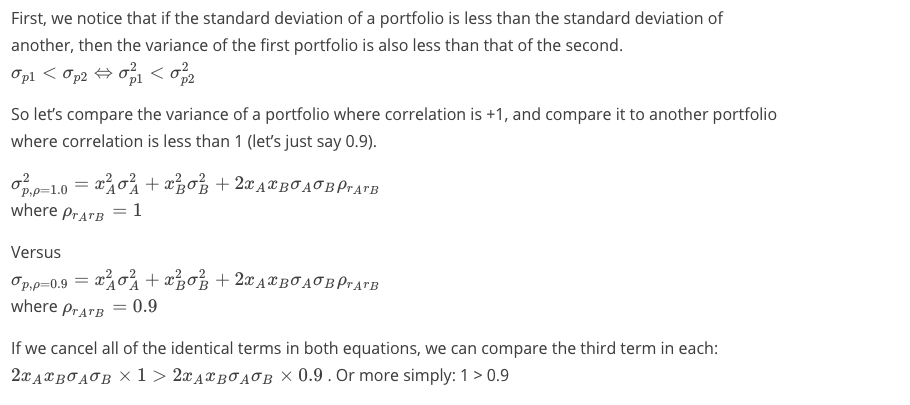
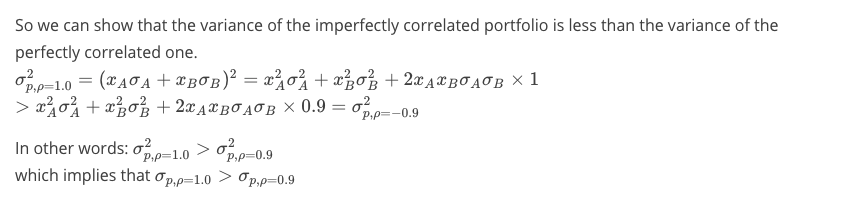
The nice benefit of putting two stocks into a portfolio is that, as long as they’re not perfectly correlated, we’ll end up with a portfolio whose risk is less than the the weighted sum of the individual risks. A key benefit of portfolio diversification is that it helps us to reduce risk!
将两只股票投入投资组合的好处是,只要它们没有完全相关,我们最终会得到一个风险低于个别风险加权总和的投资组合。投资组合多样化的一个主要好处是它可以帮助我们降低风险!
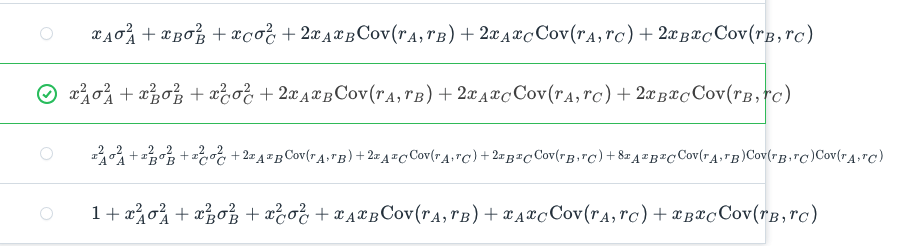
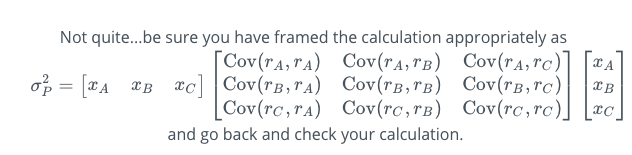
Varince of a 3-Asset Portfolio
What is the variance of a portfolio with 3 assets, A, B and C, with weights \(x_A , x_B , and x_C\) ?
The Covariance Matrix and Quadratic Forms
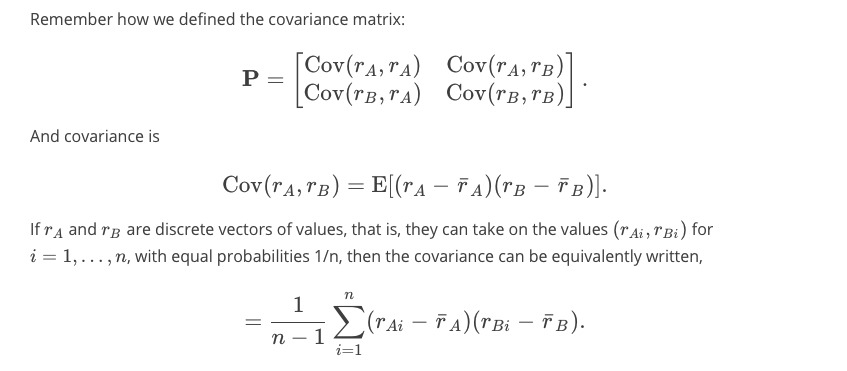
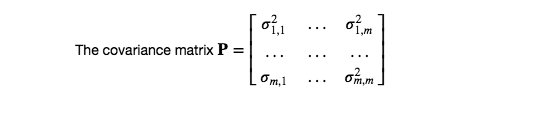
The Covariance Matrix(协方差矩阵)
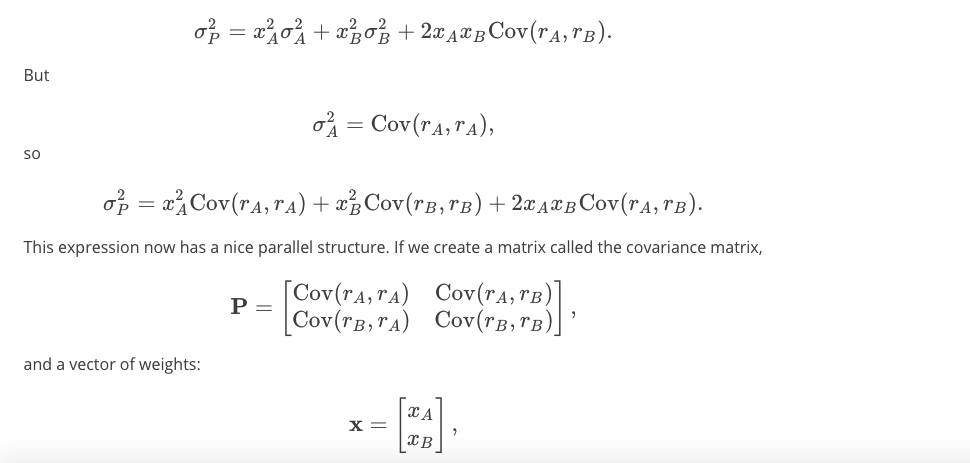
Let's take a moment to learn a compact way to represent the portfolio variance using matrices and vectors.
让我们花点时间学习一种使用矩阵和向量表示投资组合方差的紧凑方法。
Remember that the portfolio variance we calculated for our two-stock portfolio was:
请记住,我们为双股票投资组合计算的投资组合差异为:
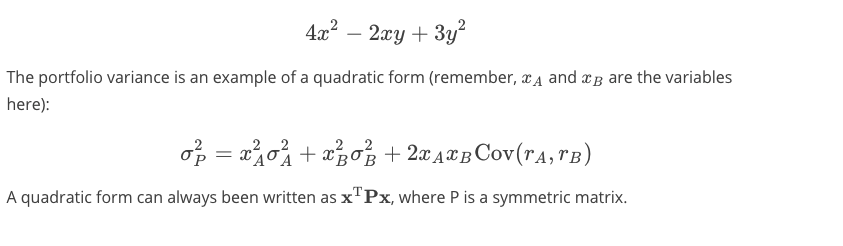
Quadratic Forms(二次形式)
A polynomial where the sums of the exponents of the variables in each term equals 2 is called a quadratic form. An example:
每个项中变量的指数之和等于2的多项式称为二次型。一个例子:
Calculate a Covariance Matrix
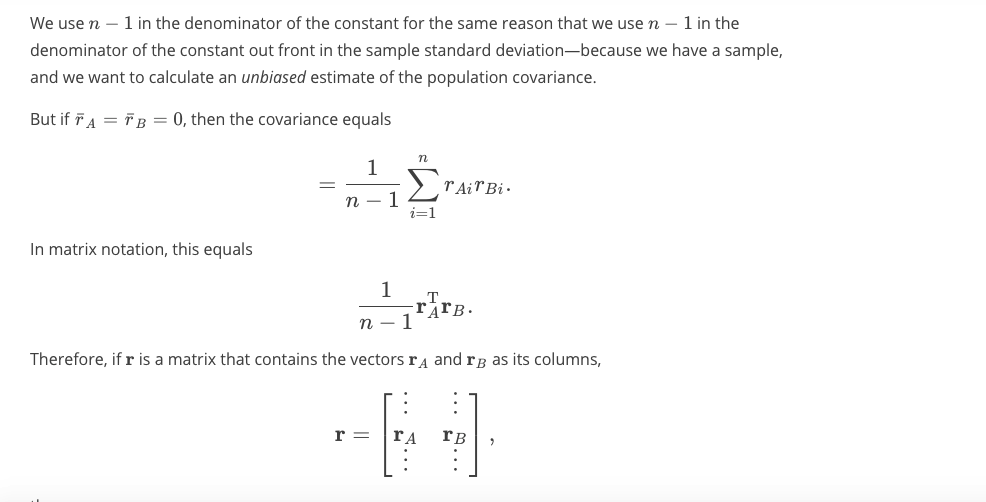
因此,如果数据矩阵中的每个观测向量的平均值为0,则可以将协方差矩阵计算为:

Quize:np.cov
Covariance Matrix
Install libraries
import sys
!{sys.executable} -m pip install -r requirements.txt
Collecting numpy==1.14.5 (from -r requirements.txt (line 1))
Downloading https://files.pythonhosted.org/packages/68/1e/116ad560de97694e2d0c1843a7a0075cc9f49e922454d32f49a80eb6f1f2/numpy-1.14.5-cp36-cp36m-manylinux1_x86_64.whl (12.2MB)
[K 100% |████████████████████████████████| 12.2MB 38kB/s eta 0:00:01 19% |██████▎ | 2.4MB 41.2MB/s eta 0:00:01
[?25hInstalling collected packages: numpy
Found existing installation: numpy 1.12.1
Uninstalling numpy-1.12.1:
Successfully uninstalled numpy-1.12.1
Successfully installed numpy-1.14.5
[33mYou are using pip version 9.0.1, however version 19.0.3 is available.
You should consider upgrading via the 'pip install --upgrade pip' command.[0mImports
import numpy as np
import quiz_tests
Hints
covariance matrix
If we have $m$ stock series, the covariance matrix is an $m \times m$ matrix containing the covariance between each pair of stocks. We can use numpy.cov to get the covariance. We give it a 2D array in which each row is a stock series, and each column is an observation at the same period of time.
Quiz
import numpy as np

def covariance_matrix(returns):
    """
    Create a function that takes the return series of a set of stocks
    and calculates the covariance matrix.

    Parameters
    ----------
    returns : numpy.ndarray
        2D array containing stock return series in each row.

    Returns
    -------
    x : np.ndarray
        A numpy ndarray containing the covariance matrix
    """

    #covariance matrix of returns
    cov = np.cov(returns)

    return cov

quiz_tests.test_covariance_matrix(covariance_matrix)
Tests Passed"""Test with a 3 simulated stock return series"""
days_per_year = 252
years = 3
total_days = days_per_year * years
return_market = np.random.normal(loc=0.05, scale=0.3, size=days_per_year)
return_1 = np.random.uniform(low=-0.000001, high=.000001, size=days_per_year) + return_market
return_2 = np.random.uniform(low=-0.000001, high=.000001, size=days_per_year) + return_market
return_3 = np.random.uniform(low=-0.000001, high=.000001, size=days_per_year) + return_market
returns = np.array([return_1, return_2, return_3])
"""try out your function"""
cov = covariance_matrix(returns)
print(f"The covariance matrix is \n{cov}")The covariance matrix is
[[0.07918553 0.07918553 0.07918554]
[0.07918553 0.07918554 0.07918555]
[0.07918554 0.07918555 0.07918555]]Efficient Frontier(高效的前沿)
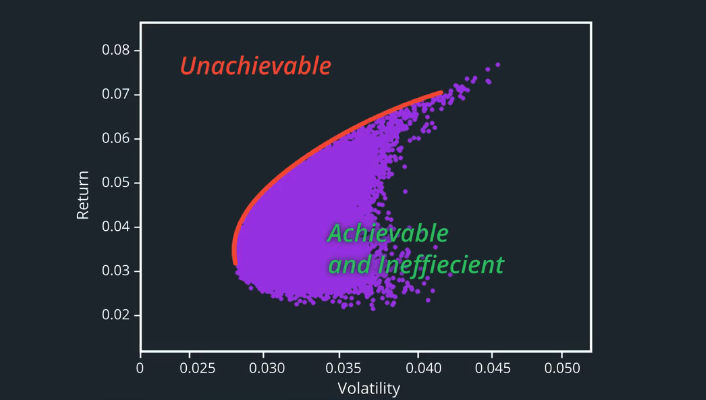
Efficient Frontier
The efficient frontier for a given set of stocks gives us the set of portfolios that achieve the highest return for each level of risk. The efficient frontier also contains the set of portfolios that achieve the lowest level of risk for each level of return. We refer to these portfolios along the efficient frontier as market portfolios. As portfolio managers, we would be interested in finding the weights for each stock that create these market portfolios on the efficient frontier.
给定一组股票的有效前沿为我们提供了一系列投资组合,可以实现每个风险级别的最高回报。有效边界还包含一组投资组合,可以为每个回报水平实现最低风险。我们将有效前沿的这些投资组合称为市场投资组合。作为投资组合经理,我们有兴趣找到在有效边界上创建这些市场投资组合的每只股票的权重。
Minimum Variance Portfolio(最小方差投资组合)
The minimum variance portfolio is a single portfolio in the efficient frontier that has the lowest risk.
最小方差投资组合是有效边界中风险最低的单一投资组合。
Capital Market Line
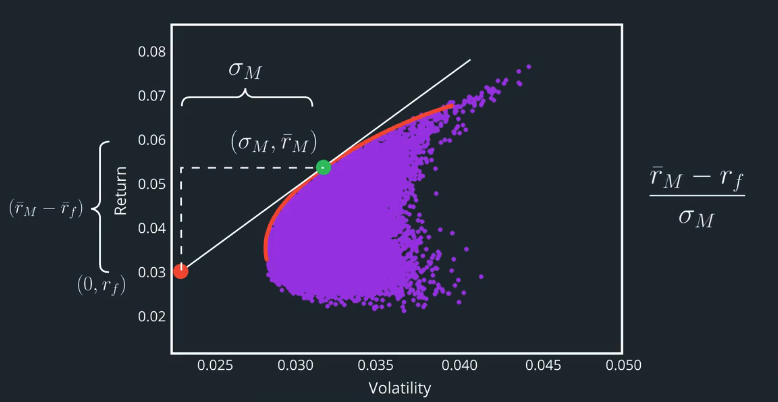
Treasury Securities(国库券)
Treasury securities are IOUs from a government. They are government debt instruments used to finance government spending as an alternative to taxation. In the case of stable governments, they are considered relatively risk-free. In the U.S., Treasury bills mature in 1 year or less, Treasury notes mature in 2 to 10 years, and Treasury bonds mature in 20 to 30 years.
美国国债是政府的欠条。它们是政府债务工具,用于资助政府支出作为税收的替代方案。在稳定政府的情况下,它们被认为是相对无风险的。在美国,国库券在1年或更短时间内到期,国债在2至10年内成熟,国债在20至30年内到期。
为者常成,行者常至
自由转载-非商用-非衍生-保持署名(创意共享3.0许可证)


